 The flooring industry as a whole in 2018 continued on its slow but steady growth curve in terms of dollars—a journey that began in 2011 and shows no signs of abating. The growth is led by the resilient category in general and the waterproof subsegment in particular, which is basically carrying the floor covering industry on its back. That’s the good news. The not-so-good news is that it is becoming obvious that resilient is cannibalizing dollars from just about every other flooring category, all of which were either flat, up or down slightly in both dollars and volume, with the exception of carpet volume.
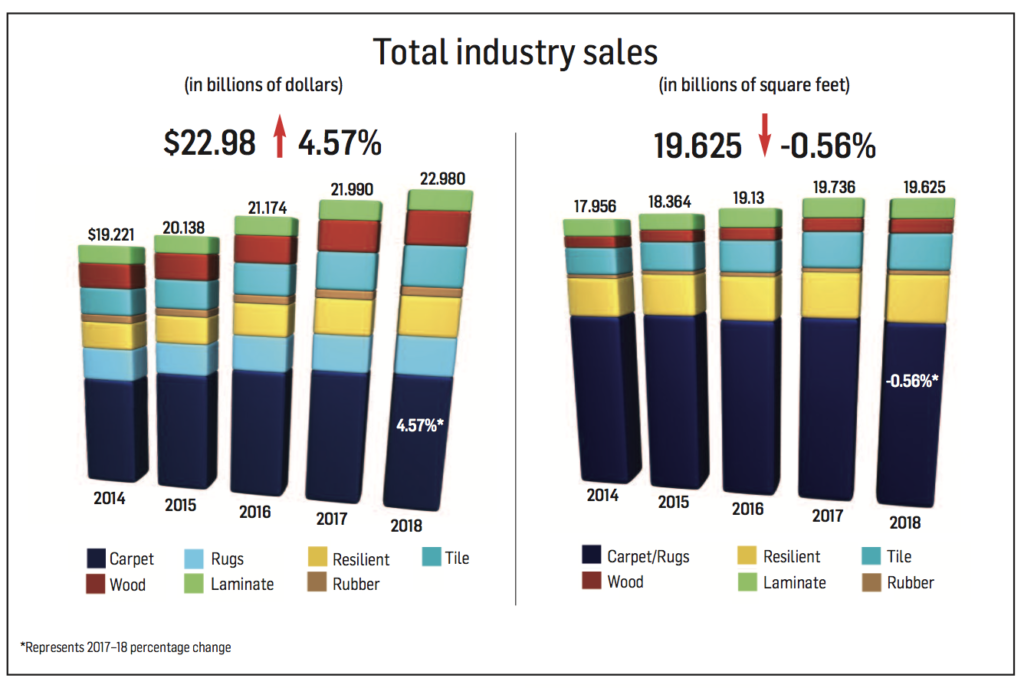
While growth rates pale in comparison to the mid-2000 heydays, the industry last year continued to post steady gains across the board with an increase of 4.57% in dollars. However, total volume was down slightly (-0.56%) for the first time since 2011. FCNews research reveals that carpet (which comprises 54.3% of industry volume) dropped approximately 475 million square feet, and not even the high-powered resilient segment can make up for that. This comes on the heels of 3.85% growth in dollars and 3.2% in volume in 2017; 5.1% growth in dollars and 3.8% in volume in 2016; 4.4% growth in dollars and 3.2% in volume in 2015; and 3.6% and 1.8% growth, respectively, in 2014. In fact, 2018’s figures represent the ninth consecutive year of dollar increases.
FCNews’ exclusive research reveals total 2018 flooring sales topped out at $22.98 billion and 19.625 billion square feet. (These numbers are in wholesale dollars reflecting the first point of sale. They also do not include stone flooring, nor does it account for ceramic wall tile, cove base and rubber accessories.) It’s the highest dollar count since 2006 and the second highest volume number since 2007, eclipsed only by 2017’s 19.736 billion square feet.
Some good news: The industry is beginning to get close to the peak it reached in 2006, when sales of $24.175 billion and 26.36 billion square feet were posted. Flooring currently sits just 4.9% below 2006’s dollar mark although still 25.6% off in volume. What does that mean? More good news: Back then, the average square foot price of flooring was a shade under $0.92. Today that figure is $1.17. Attribute that to a multitude of price hikes, better goods infiltrating the marketplace, favorable product mixes, more retailers using credit as a tool and, of course, a stronger economy with historically low unemployment rates. Tariffs on Chinese-imported LVT, WPC and rigid core also contributed, but it was only 10% in 2018 and not every manufacturer increased prices.
Let’s look at the industry in another way. When we entered this decade back in 2010, we were recovering from the Great Recession and flooring sales were $16.221 billion and 16.625 billion square feet. As we approach the end of the decade, the industry is up 41.7% in dollars and 18% in volume. So the average selling price of one square foot of flooring has increased 19.5 cents in the last nine years.
Another thing to keep in mind about the numbers: Ten years ago FCNews included cove base and accessories in its rubber flooring numbers. Two years ago we made the decision to include only sheet and tile flooring in our rubber numbers and only adjusted back to 2012. In the absence of that change, 2018’s volume could have eclipsed 2007’s volume figures.
As mentioned, the average selling price of all flooring in 2018 was $1.17, up from $1.11 in 2017, 2016 and 2015. On the surface, you can focus on price increases as the primary reason. Carpet was basically flat in dollars and down about 4% in volume. The multiple price hikes are what kept dollars about even. Wood also experienced a few price increases, most noticeably on red and white oak species.
But at the end of the day, one need only look at the resilient category for an explanation for the rise in ASP. Twelve years ago, the average selling price for all resilient flooring was $0.64. Two years ago it was $1.04. Last year it was up another dime. A decade ago, sheet vinyl, vinyl composition tile (VCT) and the low-cost, peel-and-stick tile commanded 75% of dollars. Last year that number plummeted to 22.5%, down from 28.8% in 2017. (In terms of volume, that number is a more healthy 43.2%.) The increased usage of the higher-cost LVT, both residentially and commercially, and now WPC/SPC/rigid, have been industry game changers.
 But it’s not just resilient. The average ceramic tile price has increased from $0.95 to $1.19 per square foot over the last 10 years, and hardwood has seen an average-square-price jump from $2.36 to $2.52 per square foot. Even the maligned soft surface segment—which has seen its share of the market dip from 64% in 2007 to 49.5% in 2018 (and down from 51.9% in 2017)—has seen an increase in average pricing from $0.89 to $1.06. For the record, laminate is the only category with pricing in decline, going from $1.21 a square foot in 2008 to $1.09 in 2018. (Pricing has actually held at that mark for three years running.)
Laminate and carpet were the only categories in 2018 to show a decline in both dollars and volume—the latter taking a significant hit on the volume side. Laminate attributes its fallback to a decline in import shipments and lower domestic production capacity in 2018, but mostly the growing popularity of WPC/rigid core.
Why has the growth been slow and steady and not more robust? For one, housing has not led the recovery from the recession and is actually lagging the overall economy. While it continues to rebound and grow each year, housing starts are still below the 1.4 million threshold that is considered normal. Also, in past recoveries there has always been a period of strong economic growth before it settles into normal growth mode. That has not happened with this strong economy.
But there have been many positives. The U.S. economy continues to grow as consumer spending (due to rising employment) and household income (and with it disposable personal income) are on the rise. Commercial construction continues to rebound, and corporate pre-tax profits grew again in 2018.
Also not to be underestimated as a flooring market driver is an aging baby boomer population. Boomers control the lion’s share of this country’s disposable income and are in their prime spending years. Furthermore, many are buying second homes, or at the very least transitioning into different places of residence.
Resilient
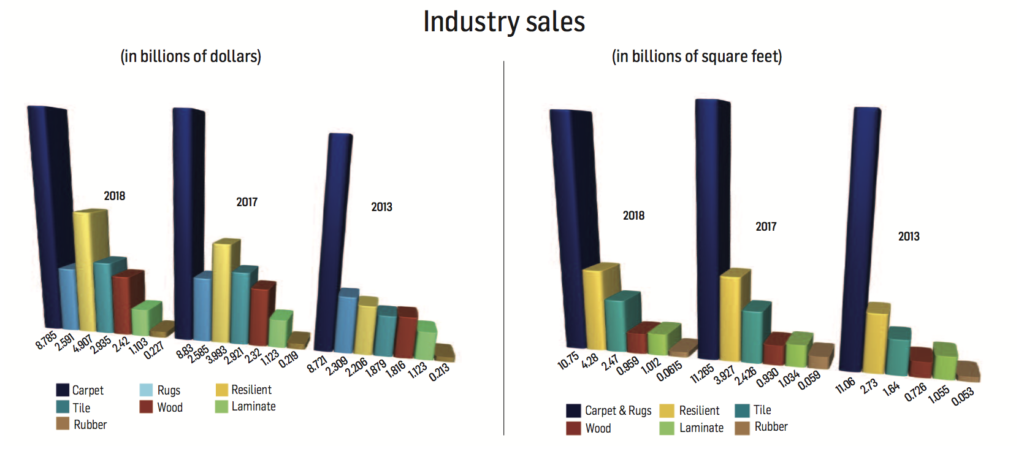
Much like the past few years, the resilient category continues to be the locomotive powering the industry, with WPC/rigid core serving as the catalyst for this explosive growth. In 2018, resilient (not including rubber flooring, which checked in at $227.4 million) carried the industry on its shoulders, posting meteoric gains, rising 23.1% to $4.916 billion from $3.993 billion in 2017. Since 2010, the category has increased a stunning 185% and is now at its highest point in history in terms of dollars. Interestingly, it has “only” increased 84.5% in volume, again accentuating the migration from felt-backed products to fiberglass sheet, along with the transition from residential/commercial sheet and VCT to LVT and WPC/rigid.
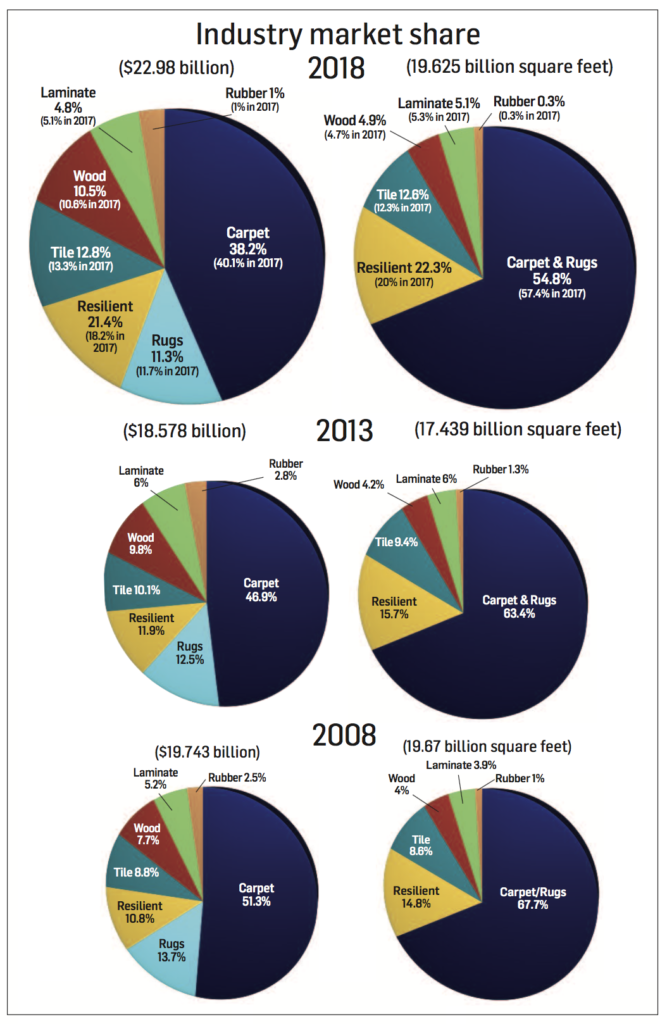
In the grand scheme of things, resilient now accounts for 21.4% of the total flooring market in dollars (up from 18.2% in 2017) and 22.3% in volume (up from 20.4% in 2017) after a 9.5% rise in units to 4.373 billion square feet. In 2017, resilient held an 18.2% market share in terms of dollars, which was up from 16.5% in 2016; 13.3% in 2015; 12.2% in 2014; and 11.9% in 2013. Interestingly, its market share in volume had stayed around 15% for eight consecutive years until leaping to 17% in 2015; 18.8% in 2016; 20% in 2017; and now 22.3%.
FCNews research reveals just how much LVT—along with its sub-category, WPC/rigid core—is driving growth of the segment. LVT sales have gone from nearly $750 million in 2012 to $3.687 billion in 2018. That means the category has grown nearly five times in six years. But it is no longer sufficient to strictly talk about LVT. WPC/rigid core has taken on a life of its own these past two years with astronomic growth in 2018. In illustration, 2017 sales were $936.3 million (92.4% residential) and 480.25 million square feet (93.1% residential). In 2018, FCNews research reveals this subsegment posted sales of $1.761 (91.4% residential) and 932.2 million square feet (90.4% residential).
To put this in perspective, WPC/rigid core now comprises 47.8% of all LVT (up from 34.9% in 2017) and 61.9% of all residential LVT sales in dollars. In terms of volume, WPC/rigid core constitutes 38.1% of all LVT and 45.6% of all residential LVT. And at $1.90 per square foot, it is the most expensive resilient flooring product aside from linoleum, rubber and commercial sheet.
LVT/WPC/rigid core in general also carries with it a premium price tag as it comprises 75.4% of the category’s dollars but only 56% of its volume. To illustrate its growth, those numbers were 37.4% and 20.6%, respectively, in 2012.
As LVT grows, it is taking share from other resilient categories, especially VCT, which today is only 5.7% of resilient dollars and 11.6% of volume. Six years ago, those numbers were 19.7% and 26.8%, respectively. But it is also nipping share from sheet vinyl as well. Sheet vinyl—residential and commercial combined—has declined 2.1% in the last four years, going from $756 million in 2014 to $740.4 million in 2018. Commercial has taken the bigger hit, declining 11.9% in dollars from $254.24 million in 2013 to $224 million in 2017. However, the category may have been up slightly in 2018 with estimated sales of $232.5 million. It remains a mainstay in healthcare, where a more seamless floor covering is demanded. The category has been a challenge for just about everyone, with heterogeneous continuing to take share from homogeneous—a segment that really has only three players remaining: Armstrong, Mannington and Tarkett.
Carpet
What began as a somewhat promising year for carpet ended with the category down in sales and volume for both residential and commercial. You would have to go back to 2010 to find the last year in which soft surface was down across the board.
In 2018, carpet was victimized by outside forces (four Federal Reserve rate hikes and a government shutdown) and internal issues (multiple carpet price increases) as well as the incredible dominance of the LVT segment, which has kept carpet from gaining any positive momentum.
 The cumulative effect of losing ground to hard surfaces is fairly stunning. While carpet/rugs comprise 54.8% of the overall flooring market, that compares to 67.7% in 2008, a full 13 market share points lost in that span.
While the growth of LVT has been instrumental in carpet’s decline, the soft surface segment has its own internal issues. The widening gulf between low- and high-end goods has meant that a significant middle market— priced between $8 and $14 per square yard—has been rendered irrelevant. On the contrary, solution-dyed polyester has bolstered the commodity end of the market, while high-end decorative carpet and rugs has created pockets of opportunity at the high end.
On the commercial side, 2018 marked another down year in terms of sales and units. The struggles of the commercial business can be tied directly to the overwhelming strength of the LVT/SPC market that continues to expand its footprint in all applications, and in the process pushing carpet to the margins. As Mike Gallman, president of Mohawk Group, explained, “You can’t talk about carpet without talking about hard surfaces.”
Where carpet has been specified in commercial, it is mostly modular carpet getting the call. Top executives estimate that car- pet tile now makes up about 80% of K-12 carpet installations and about 90% in healthcare.
Going forward, the industry hope is that the share of carpet should stabilize and maintain a prominence in the home thanks to the category’s aesthetics and functional benefits such as soft- ness underfoot, noise abatement and overall design capabilities.
Ceramic
While 2018 again saw growth for the ceramic tile market, those gains were down compared to that of the previous year. One tile supplier told FCNews that while both the commercial and residential segments saw growth, it was the lowest since the economic crisis. For example, 2017 saw jumps of 5.8% in sales an 5% in volume—the second largest segment gain next to resilient—translating into $2.921 billion in sales and 2.426 billion square feet in volume. In 2018, FCNewsresearch showed the category saw about 2% growth to 2.474 billion square feet. Sales were relatively flat for the category, registering less than 1% growth to $2.935 billion. Another supplier noted the buildup of inventory, especially from China, during the last quarter in anticipation of the higher tariff scheduled for 2019.
Several factors challenged the category in 2018. The housing market, for example, historically serves as a good reference for how the ceramic tile market will fair. While the housing market has experienced modest growth climbing out the recession, it really hasn’t led the charge. In fact, many industry observers noted a cooling in housing last year. The remodeling segment admittedly saw gains; however, ceramic tile doesn’t garner nearly as much in sales from the segment as it does with new projects, one industry observer noted. Ongoing trade disputes with China also impacted the ceramic tile market as tariffs scheduled for 2019 put questions in the minds of consumers, manufacturers and importers. Competition from other categories, expressly LVT, also put pressure on the category. Tile suppliers noted a need to focus on innovation and cost to help withstand the pressure from LVT in the future.
Moving forward, suppliers noted a positive attitude toward the ceramic tile market’s health. However, several economic factors will have to be resolved before a true understanding of the market’s potential is understood. “We are seeing a lot of reluctance in investment with both consumers, builders, manufacturers and distributors until there is more certainty around the macro economic and political climate,” said Raj Shah, president, MSI International. “Never has the industry been tested with such large-scale factors as Section 301 tariffs, anti-dumping investigations, etc. The hope is that much of this will settle in the third quarter. We will then see investment decisions being made again, which will result in growth of the industry.”
Wood
The hardwood category, the segment that arguably relies most on raw materials, shows just how movement in lumber prices can impact the final numbers. While many suppliers both large and small report modest gross increases in sales, those increases were heavily mitigated by numerous price hikes that took place over the course of 2018. That was particularly the case with in-demand species such as white and red oak, and, to a lesser extent, hard maple and walnut. (Tropical exotic imports were a whole other story.)
Another factor that impacted pricing was demand from inter- national markets, observers say. With more hardwood flooring production taking place in China and Southeast Asia, export demand put additional pressure on pricing. Couple that with intense competition from LVT, WPC and SPC—segments that take direct aim at entry-level hardwood flooring products.
At the end of the day, the hardwood flooring category generated $2.42 billion in sales, a 4.4% increase over 2017. The volume of hardwood flooring sold at the first point of distribution also grew, albeit at a slower rate (3.2%), to 959 million square feet, reflecting higher-priced product and better-quality goods. The category’s saving grace was the residential replacement sector, which grew its share of the pie in 2018, accounting for roughly 58% of hardwood end use. That’s up a few percentage points from 2017, when residential replacement activity accounted for approximately 55% of wood sales. But that growth came at the expense of lower consumption by the new home construction sector, which fell to roughly 33.5% of sales last year compared to 35% in 2017.
 Laminate
The laminate category—once considered the “WPC” of its heyday back in the mid-1990s—continues to lose market share. FCNews research shows laminate flooring sales dipped to just over $1.103 billion last year, a 1.7% decrease from 2017. It also represents the second consecutive year of sales declines in the category.
Naturally, the volume of laminate flooring sold in the U.S. was commensurate with the stagnation in dollar growth. In 2018, volume was estimated at 1.012 billion square feet, a 2.1% decrease over the prior year on top of a 1.9% decrease in volume sold in 2017. Even more telling is the fact that laminates’ portion of the overall flooring market fell to roughly 4.8%, down from 5.1% of total industry dollars in 2017. With respect to volume, the category represented approximately 5.2% of total square footage sold, down slightly from 5.3% in 2017. The category also saw a dramatic falloff in shipments from vendors belonging to the European Producers of Laminate Flooring—a coalition that in the past accounted for more than 40% of laminate imports.