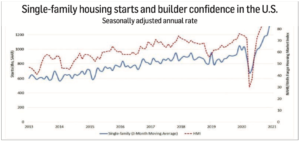
 By Elisabeth McGowan The U.S. housing market defied the odds in 2020 as total housing starts—a key barometer of economic activity—grew 7% to nearly 1.38 million units (not seasonally adjusted) last year. Single- family units led the surge with just over 990,000 starts registered last year—an 11.5% increase over 2019. That’s more than twice the growth rate seen in total housing starts from 2018-19—all in a pandemic year, no less.
From a regional perspective, the South accounted for the highest number of single-family housing starts (55.8%) at 553,100 units. The second-strongest region was the West, with 241,500 single-family starts (24.4%). The Midwest and the Northeast regions came in third and fourth place, respectively, accounting for 13.7% and 6.1% of single-family housing starts.
Not all segments of the housing market experienced growth in 2020, however. Total multifamily units (including apartments and condos) actually fell from 402,300 units in 2019 to 389,100 last year—a drop-off of 3.3%. On balance, however, 2020 exceeded many analysts’ expectations of how the market would fare based solely upon how the year started off.
Here’s a brief look back on the comeback:
Last year actually started off with a decline in overall housing starts. U.S. Commerce Department statistics show total U.S. housing starts in January 2020 dropped 3.6% over the previous month to a seasonally adjusted annual rate of 1.567 million units. This on the heels of three consecutive monthly increases. February followed up with another decrease, albeit a slight one—a 1.5% drop to 1.599 million units.
Then came March, when the bottom literally fell out. Homebuilding activity in the U.S. cratered as the coronavirus spread, with total housing starts tumbling 22.3% from February. Groundbreakings in March 2020 hit a seasonally adjusted annual rate of 1.2 million units, down from a 1.56 million pace in February. Construction of single-family houses fell 17.5%, while multifamily starts were off 32.1% from the prior month. According to the U.S. Commerce Dept., the drop in housing starts was the worst monthly decline since the 1980s, when new home construction plunged 26.42% in March 1984.
April 2020 didn’t fare much better. Housing starts during the month tumbled more than 30%, the lowest level since early 2015. In May, however, the tide began to turn. Total starts during the month grew more than 11% to 1.038 million (seasonally adjusted) units. At that time, Chuck Fowke, chairman of the National Association of Home Builders (NAHB), said the growth was in line with rising builder sentiment—a trend that would continue for the ensuing seven months. “With home building considered an essential business, this solid sales report is another indicator that housing is leading the economic recovery,” he recalled.
That started the climb out of the abyss and kicked off a trend that would see total housing starts grow each month—with the exception of the typically slow July-August period—culminating in 1.670 million seasonally adjusted starts in December 2020. Robert Dietz, NAHB chief economist, described the pace seen in December as “the highest since September 2006.”
Homeownership rates tick up
 The 2020 housing market recovery was evident in metrics other than pure housing starts. Sales of both new and existing homes increased in the second half of 2020 all the way through to the end of year as more people moved from big cities to the suburbs to avoid densely populated areas in the midst of a pandemic. This had a positive impact on overall homeowner- ship. According to the U.S. Census Bureau’s “Quarterly Residential Vacancies and Home Ownership—First Quarter 2021” report, home- ownership rates rose significantly in 2020. During the first quarter, homeownership rates grew to 65.3%, followed by 68.1% in the second quarter. Rates remained relatively high in the third and fourth quarters, accounting for 67.9% and 67.4%, respectively.
Industry observers attributed the rise in homeowner- ship to several key factors, including more people working and learning from home. To that end, research shows suburban homes sold out quicker overall in 2020 than the previous year, according to the report, “Urban Vs. Suburban Growth: The Grass is Greener in the Suburbs,” by Sabrina Speianu, senior economic research analyst at realtor.com.
After a brief halt, due to the constraints of the new COVID-19 measures and uncertainty, home sales began to pick up by May 2020. Many homes went through a few months of staying on the market in the second quarter of 2020, with urban homes spending a total of 34.6% more time on the market versus 2019, and suburban homes 28.5% longer than they did in the year prior. However, by the summer of 2020, buyers who had previously paused their plans to purchase rushed in seemingly all at once, Speianu noted.
The other factor that led buyers to flee to the suburbs was the demand for larger homes. Analysts pointed to data showing purchasing activity was 46% higher with respect to homes with four or more bedrooms and 33% in homes with three or more bathrooms. “The primary reason is that COVID-19 has led a segment of home buyers to desire larger homes and to move out to the suburbs,” said Rose Quint, assistant vice president of survey research at the NAHB, citing an association trends report.
The report, “NAHB Identifies Top Key Features and Design Trends for 2021 in the Wake Of COVID-19,” also noted that the uptick in room number shows a trend of residential adaptability—meaning homeowners got more creative in how they use the space within their homes. Even after the COVID-19 restrictions eased in some regions, homeowners understood that they needed to adapt to a new lifestyle. For example, exercising at home became common despite public gyms reopening later on throughout the year.
The NAHB report also assessed the specific features of the home that matter the most to buyers in the market today. These features include double kitchen sinks, walk-in pantries and patios and front porches, to name a few. “The space works harder rather than larger,” said Donald Ruthroff, AIA, principal at Dahlin Group Architecture Planning. “Open spaces are better defined and spaces are flexible.”
The same NAHB report polled homeowners on the subject of whether or not the pandemic affected housing preferences. Interestingly, the survey concluded that 67% felt the pandemic did not impact their housing preferences; only a quarter of respondents agreed that the pandemic affected their preferences. The ones who felt the pandemic’s impact were mainly households with at least one remote worker and one virtual-learning student. Such households are also the most likely to desire a larger home.
Affordability factor
 Despite the brisk activity in the housing market, affordability is still an issue for many people, particularly those living in urban areas. New York, Philadelphia, San Francisco, Los Angeles and Detroit, for example, experienced drops in new home sales and ownership rates to the tune of 5%-6% year over year, according to the Annual Housing Market report by realtor.com.
With many American city residents struggling to afford a new home purchase by the end of 2019, the decrease that 2020 experienced in urban area total home sales was already expected even before the pandemic’s economic impact. However, that didn’t blunt the market’s overall momentum. “Buyer traffic remained strong in October of 2020 even as the country’s attention was focused on the elections and policy issues—such as the property tax deduction going into 2021,” NAHB’s Fowke said. “Mortgage rates remain low and builder confidence is at an all-time high, indicating that demand remains steady and sales will remain solid.”
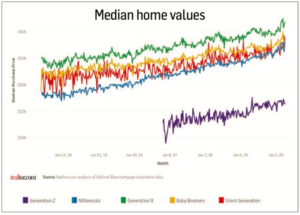
The strength of the U.S. housing market was also reflected in the median value of home prices. According to data provided by the U.S. Census Bureau, the U.S. median sales price increased to $330,600 in 2020 compared to $322,400 in 2019. Further research from the NAHB showed new home sales were up in all four regions by the end of 2020: 29.9% in the Northeast; 29.8% in the Midwest; 18.5% in the South; and 20.1% in the West.
Generational trends
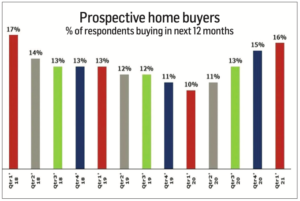
You can’t talk about homeownership rates and affordability without discussing the impact of millennial buyers. General interest among millennial prospective buyers rose steadily from 10% in the first quarter of 2020 to 16% in the fourth quarter of the year, according to the NAHB’s report, “COVID-19 Continues to Fuel Desire for Homeownership.” The report went on to say that millennial-aged buyers’ interest in purchasing a new home doubled from 16% in 2020 to 32% into the first quarter of 2021.
A realtor.com report, “Q1 Generational Propensity Report,” outlined five markets that lost millennial buyers during the past year. These included: New York City, New Jersey, Pennsylvania and parts of Southern California. Instead, more millennial buyers are tareting less-dense areas such as the Charlotte-Concord- Gastonia, N.C.-S.C., Northern California and Upstate New York.
Not only are more millennials becoming first-time home buyers, but they are also financing larger mortgages. According to realtor.com, the median loan amount this demographic group took on in 2020 increased 14.5% over the year before. By comparison, baby boomer-aged homeowners generally opt for smaller financial loan amounts due to their ability to contribute larger down payments toward a new home.
“For those who have weathered the pandemic well by keep- ing their jobs, there have been some opportunities to become homeowners,” said Danielle Hale, chief economist, realtor.com. “They can take advantage of low mortgage rates, and they may be able to save more for a down payment because they’re not spending as much going out.”
Outlook for 2021
 As the nation continues to grapple with the fallout from the coronavirus pandemic, industry analysts remain watchful for any signs that might provide a glimpse into the vitality of the ongoing housing market recovery. So far, the signs are encouraging. According to a recent Census Bureau report that outlines new residential construction trends, privately owned build- ing units authorized by permits were 30.2% higher in March this year than the same period in 2020.
Another telling indicator of builder confidence is the NAHB/Wells Fargo Housing Market Index, which rose to 83 in April—the latest period for which stats are available. (Note: Anything above 50 is considered positive. By comparison, last April the index plummeted to 30 and then shot back up over the summer.)
That optimism, however, is being tempered by the fact builders are facing rising mate- rial and labor costs amid strong demand from potential buyers.
“The supply chain for residential construction is tight, particularly regarding the cost and availability of lumber, appliances and other building materials,” NAHB’s Fowke— himself a custom homebuilder from Tampa, Fla.—stated. “Though builders are seeking to keep home prices affordable in a market in need of more inventory, policymakers must find ways to increase the supply of building materials as the economy runs hot in 2021.”
Strong buyer demand from 2020 ultimately encouraged builders even against the backdrop of rising lumber costs. “Builder concerns about a changing regulatory landscape may have triggered many to move up their plans to pull permits and put shovels to the ground,” Fowke added. “Our latest builder sentiment survey suggests somewhat softer numbers ahead due to rising building costs and an uncertain regulatory climate.”
At the same time, home prices in the existing market are rising at the fastest pace in more than 15 years, and builders continue to hike prices to meet their higher costs. Low mortgage rates, which had been helping with affordability all last year, are now significantly higher than they were at the start of this year. “Our forecast is for ongoing growth in single-family construction in 2021, albeit at a lower growth rate than realized in 2020,” NAHB’s Dietz said. “One of the biggest challenges builders tell us they see in terms of the marketplace coming out of the pandemic crisis, the No. 1 issue by far is shortages and delays associated with building materials.”
In a separate report, preliminary single-family starts for March 2021 totaled 144.4 million (not seasonally adjusted units)—a 40% increase over the previous month. That’s a marked turnaround from January to February, when housing starts fell 10.5%.
With respect to multifamily starts, builders say they expect to continue experiencing softness. The NAHB said it anticipates a decrease in multifamily units in 2021 due to a slowing of rent growth and the gradual rise in lumber prices.

