Supply chain disruptions. Raw material scarcity. Inflation. One would think those issues would negatively impact any industry. But there was enough momentum on the part of consumers to drive the U.S. flooring industry to post record gains as shoppers continued to spend on home improvements in lieu of lavish vacations. On top of that, new home construction skyrocketed and many consumers in big cities chose to take advantage of record home prices and either downsize or relocate to the ‘burbs.
So many factors are driving these relocations, aptly referred to as “The Great Migration’ (see page 50). One of the biggest is the fact so many people are still working remotely, in some cases permanently. With no need to live in close proximity to the office, many consumers are citing weather- and tax-related issues for their relocation. And those who might not be able to afford a relocation or have no desire are choosing to instead spruce up their homes.

With that, the U.S. flooring industry went on a wild ride dating back to third quarter 2020, which carried through to the end of 2021. Residential carried the day, with only certain segments of commercial earning positive grades. Corporate and hospitality suffered; healthcare and assisted living were strong. Education and retail were spotty. Multi-family—which some companies consider residential while others categorize it as commercial— picked up considerably once the moratorium on evictions was lifted. Residential had its best year in modern memory; resilient, particularly the waterproof category of SPC/rigid core, posted ridiculous gains. Of course, much of the dollar growth was attributed to multiple rounds of price increases as suppliers tried to keep pace with rising costs. Containers that were once a few thousand dollars soared to as much as $20,000, in some cases more. And freight expenses once product reached these shores were through the roof.
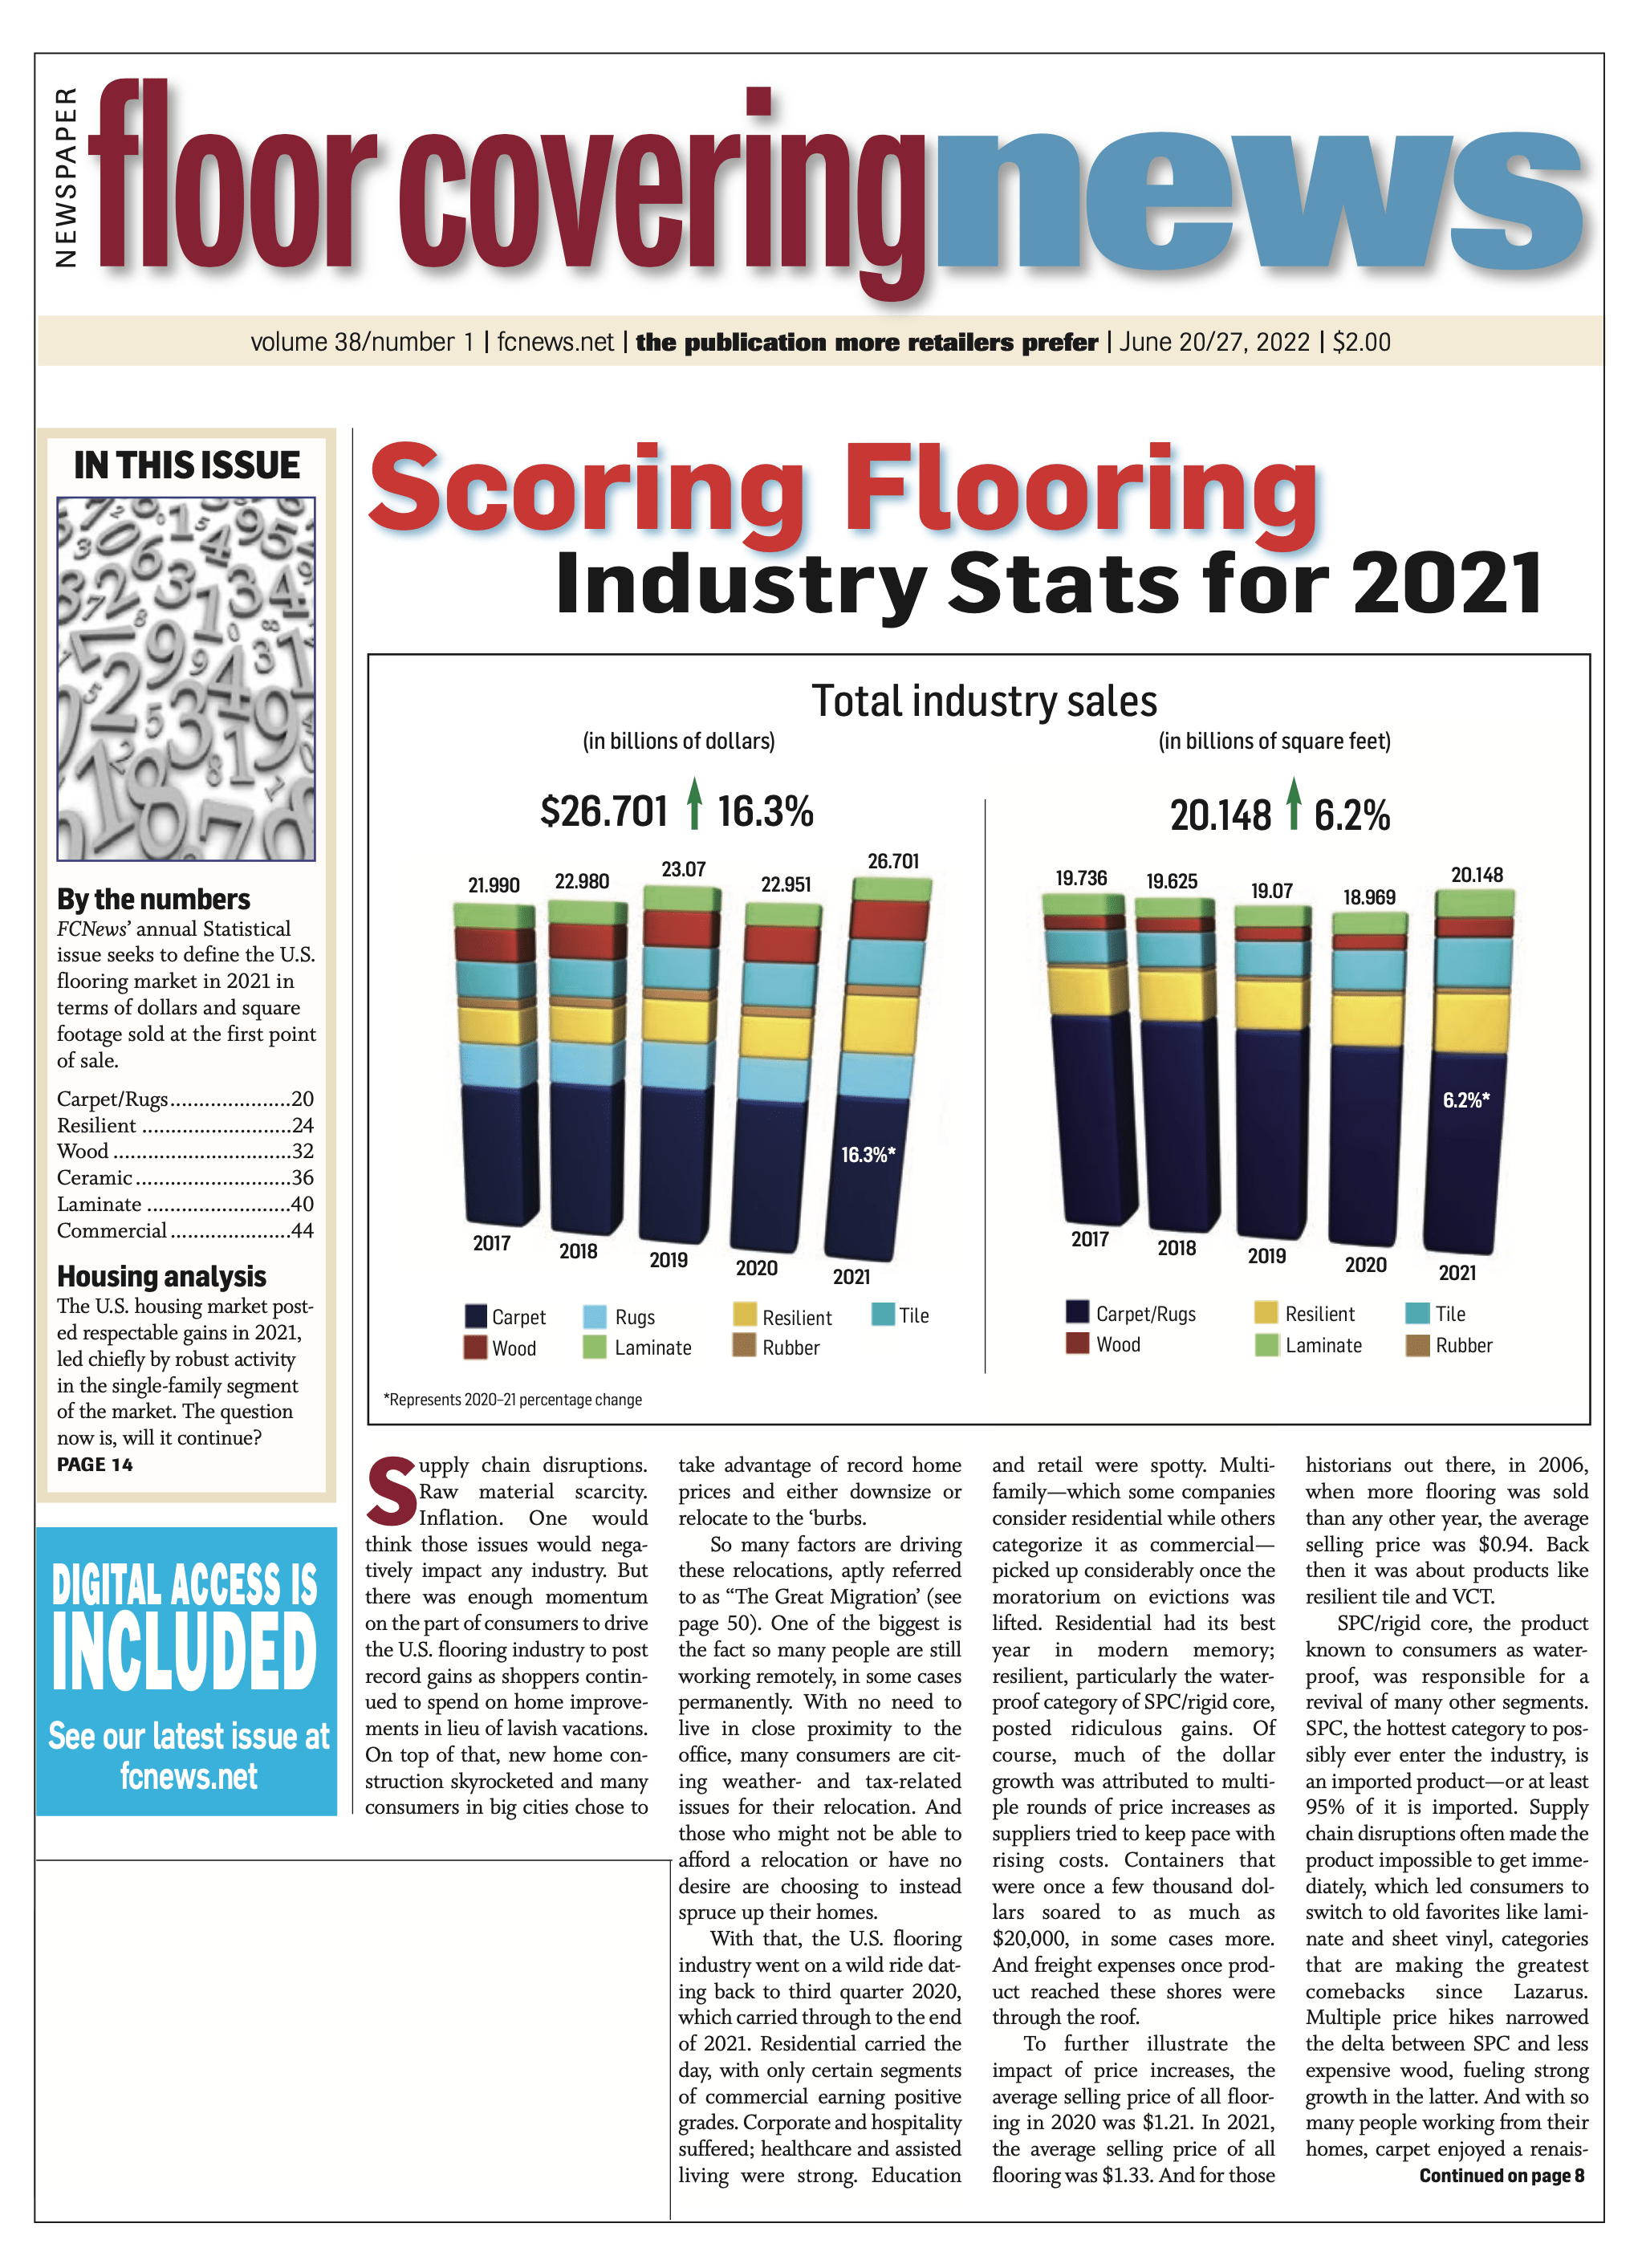
To further illustrate the impact of price increases, the average selling price of all flooring in 2020 was $1.21. In 2021, the average selling price of all flooring was $1.33. And for those historians out there, in 2006, when more flooring was sold than any other year, the average selling price was $0.94. Back then it was about products like resilient tile and VCT.
SPC/rigid core, the product known to consumers as waterproof, was responsible for a revival of many other segments. SPC, the hottest category to possibly ever enter the industry, is an imported product—or at least 95% of it is imported. Supply chain disruptions often made the product impossible to get immediately, which led consumers to switch to old favorites like laminate and sheet vinyl, categories that are making the greatest comebacks since Lazarus. Multiple price hikes narrowed the delta between SPC and less expensive wood, fueling strong growth in the latter. And with so many people working from their homes, carpet enjoyed a renaissance for its comfort and acoustical advantages.
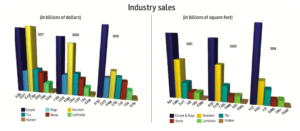
When the dust cleared and all the numbers were counted and run through the wash multiple times, total industry sales in 2021 reached a record $26.701 billion, an enormous gain of 16.3% from 2020’s $22.951 billion. (Note: These numbers are in wholesale dollars reflecting the first point of sale. They also do not include stone flooring, nor do they account for ceramic wall tile, cove base and rubber accessories.)
At no time since FCNews started tracking statistics had the industry posted an increase of this magnitude. For means of comparison, until last year, the high-water mark for the industry was in 2006 when it reached $24.715 billion. The caveat is that much of that rise was due to what seemed to be a price increase every other month. In illustration, some people said the price of the aforementioned darling, waterproof flooring, increased as much as 20% throughout the year. To further the point, the averaging selling price of SPC in 2020 was $1.59. In 2021, it was $1.85. By the way, those prices are driven down by the Home Depots and Floor & Decors of the world, which buy less expensively because of their sheer volume. When you look at the cost to retailers and distributors, it is well over $2.
A better gauge for the industry’s performance last year may lie in unit growth, or volume as we refer to it. FCNews research reveals that last year the industry went from 18.969 billion square feet in 2020 to 20.148 billion square feet, a 6.2% gain. This marks the first positive performance after three consecutive years of decline. Much of that growth, of course, is attributed to LVT/WPC/SPC, which posted a 16.3% increase in 2021. This category now represents 21% of the entire floor covering industry in terms of volume. That 20.148 billion square feet represents the first time the industry surpassed the 20 billion square-foot mark since 2007, right before the Great Recession. One other thing about 2021’s performance: This was the first year in memory where every flooring category posted gains in both dollars and volume.
FCNews research reveals that carpet and rugs (which comprises 47.9% of industry volume, down from 48.4%) gained some ground for the first time in awhile. After dropping approximately 828 million square feet and 660 million square feet the last two years, it actually grew 5%, or 510 million square feet, in 2021. In terms of dollars, carpet was up 11.5% in 2021, the first time it posted that type of growth in at least 15 years. That can be attributed to a number of factors, not the least of which were price increases. But anecdotally, as consumers were spend- ing more time at home, they were buying higher-end products, including carpet. And as mentioned earlier, with more people working from home, soft surface became more desirable for comfort and acoustical reasons.
For comparison purposes, the industry was down 0.5% in both dollars and volume in 2020. This comes on the heels of a 0.4% rise in dollars and 2.8% decline in volume in 2019; 4.6% growth in dollars and a drop-off of 0.6% in volume in 2018; 3.85% gains in dollars and 3.2% in volume in 2017; 5.1% growth in dollars and 3.8% in volume in 2016; and 4.4% and 3.2% increases, respectively, in 2015.
Let’s look at the industry in another way. When we entered the decade back in 2010, we were recovering from the Great Recession and flooring sales were $16.221 billion and 16.625 billion square feet. As we reached the end of the decade, the industry was up 0.4% in dollars but down 2.8% in volume. So the average sell- ing price of one square foot of flooring has increased $0.23.5 in the last 11 years. As mentioned earlier, the average selling price of all flooring in 2021 was $1.33. In 2020, it was $1.21, the same as in 2019 but up from $1.17 in 2018 and $1.11 in 2017.
Channel dynamics
In terms of channels, needless to say the flooring industry was fueled by residential with the Home Depots, Lowe’s and Floor & Decors of the world leading the way. Home centers—deemed “essential” businesses—were allowed to stay open during the early days of the pandemic and, therefore, capitalized while many independent retailers were forced to shut their doors.
Home centers’ windfall was palpable even beyond the immediate aftermath of the pandemic. In illustration: Home Depot’s flooring sales reached $9.225 billion in 2021, up 13.1% from fiscal year 2020. This compared to its overall sales of $151.2 billion, up 14.4% over fiscal year 2020.
Lowe’s also achieved double-digit growth in its flooring sales in 2021. The company reported fiscal year flooring revenues of $4.952 billion, an 11.4% uptick over the prior year. It’s worth noting that this rate of change actually exceeded the rate of Lowe’s total sales, which grew 7.4% in 2021.
But perhaps the most impressive growth among the big box stores was achieved by Floor & Décor. The company generated $3.434 billion in sales in 2021, a whopping 42% increase over 2020. All this via just 160 locations—up from 83 stores in 2017.
Leading the charge at Floor & Décor are sales of laminate/LVP, which, combined, account for 26% of the retailer’s business, company reports show. Tile accounted for 23% of sales while hardwood and natural stone represent 8% and 6%, respectively. Rounding out product revenues are installation materials/tools (16%) and a segment the company calls “adjacent” categories (2%).
LL Flooring (formerly Lumber Liquidators) posted net sales of $1.15 billion in 2021, up 5% over 2020. The company’s product offering largely consists of LVP, solid and engineered hardwood, laminate, bamboo flooring, porcelain tile and cork flooring.
Specialty retail, commercial
Home centers weren’t the only ones who reaped the rewards coming out of the pandemic. In the months following the outbreak in the U.S., states started lifting restrictions—some earlier than others—and specialty retailers were bombarded with consumers who were focused on home improvements.
Commercial was a challenge, particularly on the carpet side, where industry statistics have it down nearly 22% in dollars. With corporate being the largest chunk of commercial, coupled with carpet’s strong position there, this segment was most impacted by COVID-19 as states required offices to be shuttered for the better part of a quarter or half the year. As many businesses adopted work-from-home policies, corporate may suffer for the foreseeable future.
Multi-family also took a major hit as well, primarily due to a moratorium on evictions that remained in place until the end of June. That translated into far fewer turnovers than years past and, thus, a lower amount of floor covering jobs. Remember, the rental market often comprises lower-income families, and they were obviously impacted by the pandemic more so than others. It is estimated that the multi-family segment dropped between 40% and 45% in 2020, but the thought is that this piece of the business will see brighter days ahead.
There were other positives in 2020 aside from residential replacement. The housing market was solid, both in terms of new and existing homes. The year started out strong, then slowed to a crawl in March when COVID-19 hit. But the slowdown was short lived as the market rebounded quickly. With people working from home and their children in remote learning mode, there was a need for bigger spaces as families sought more square footage. At the same time, with families having to spend more time at home, there was a migration away from cities to suburbia where people could take advantage of outdoor spaces and less congestion. And finally, there were those who sought refuge in states with fewer restrictions such as Florida and Texas.
If we look at the numbers, the first two months of the year had the highest seasonally adjusted rates for existing home sales in 12 years. Sales fell off a cliff for the next three months but rebounded in June, a trend that continued through the end of the year.
Following is an overview of the categories’ respective performances in 2021:
Carpet
Decades from now, when people look back at the state of carpet, circa 2021, they might view the sales and volumes numbers and wonder if there was some mistake. After all, a double-digit gain in carpet sales—including 17.2% for residential—just doesn’t happen to a category that has been showing negligible growth for the past decade while losing market share.
But 2021 did indeed happen, with numbers that were inflated by the impacts of COVID-19, as well as unprecedented rounds of price increases and consumers’ hankering for higher-end goods.
For carpet, 2021 was a perfect storm, but it was also something of an anomaly, as first-quarter 2022 bears a dose of reality with volume down 7.3% despite overall sales up 4.5%.
Mill executives say carpet is not a one-hit wonder and can show steady, if not spectacular, growth over the next few years as technology advancements have transformed the category in terms of size, color, design and style. “What can you get for $0.90 per square foot (whole- sale)? Not much,” said Matt Johnson, senior director of residential carpet, Phenix. “But for that price you can get into some really nice carpet, and still get good value.”
There is also the belief among some mill executives that consumer attitudes have changed because carpet not only looks better but many carpets have pet warranties, and homeowners understand that ease of cleaning and built-in stain protection as a benefit.
In commercial, the outlook has brightened considerably in the past year. After 20-plus percentage declines in sales and volume in 2020, commercial finished 2021 up 2.8% in sales and flat in square feet. However, Q1 2022 shows commercial sales up 14.8% and units up 4%.
Meanwhile, the rug segment grew about 8% in 2021 over 2020 to $2.78 billion, with most of the activity coming from cut and bound or cut and serged broadloom.
Resilient
The resilient category, led mostly by the raging rigid core sub-segment of LVT, continued to gain momentum. FCNews research shows the resilient category as a whole generated $8.426 billion in sales (not including rubber) in 2021, culminating in an industry-leading 30.3% increase over 2020’s revised $6.463 billion. In terms of volume, the category accounted for 5.881 billion square feet (not including rubber) at the first point of sale, a 9.8% increase from 5.357 billion square feet in 2020.
When taking total flooring sales into account, resilient flooring comprised 31.6% of total dollar sales and 29.2% of volume compared to last year’s 28.7% of dollars and 28.8% of volume. 2020 was up from 23.6% in 2019; 21.4% in 2018; 18.2% in 2017; 16.5% in 2016; and 13.3% in 2015. Over these last several years, resilient’s share of the market has more than doubled in terms of dollars and increased by nearly half in terms of volume.
Resilient’s strong performance in 2021 is even more clear when measured against the overall hard surface market. When compared to ceramic tile, hardwood and laminate, resilient accounted for 53.6% of dollar sales (and 55.9% in volume), versus 2020’s 50.6% in sales and 2019’s 45.1% in sales.
Of course, it’s the rigid core subsegment of the resilient category that is driving the overall growth. FCNews research shows that rigid core/SPC garnered 45.6% of total resilient sales in 2021 and 34.8% of volume. That translates to $3.845 billion in sales and 2.047 billion square feet. Compare that to 2020 when rigid core/SPC checked in at $2.617 billion and 1.63 billion square feet. To put this in perspective, total LVT sales just six years ago were $1.45 billion. So, rigid core alone is nearly triple the entire LVT market in 2015.
Rigid core/SPC is still considered a residential product and that is where it shines. (Commercially it finds favor in hospitality.) While glue-down LVT and WPC still command decent shares of the residential market, the popularity of rigid core/SPC is unmatched. FCNews research shows residential SPC grew from 52% in total resilient residential dollars to 56.9%. That equates to a whopping 48.1% increase in residential dollars in 2021 vs. 2020.
In terms of its command of the residential LVT segment in which it resides, 2021 saw an increase from 58.9% to 60.2%. Specifically, it generated $3.643 billion of the LVT market’s $5.785 billion in 2021.
The ongoing positive momentum, executives say, was the direct result of lingering effects of the pandemic, the housing market boom and the category’s features and benefits.
Ceramic
The overall U.S. ceramic tile category saw high single-digit growth in 2021 compared to 2020. FCNews research shows the category experienced an 8.2% increase in dollar sales to $3.077 billion in 2021 vs. $2.844 billion in 2020. Volume in 2021 also grew, registering 3.1% growth to 2.477 billion square feet compared to 2.403 billion square feet in 2020.
The category also continued to hold strong as the third- largest sector in flooring, representing 11.5% of total industry dollars—albeit down from 12.4% in 2020. In 2021, the category also represented 26.4% of dollar sales for the gradually increasing hard surface market. That is up 21.8% and 24.9%, respectively, from 2020 and 2019.
Supported by gains in the U.S. construction and housing markets and robust overall economic growth, U.S. ceramic wall and floor tile consumption increased for the first time since 2018, according to the Tile Council of North America (TCNA) and Department of Commerce. Total U.S. ceramic tile consumption in 2021 was 3.11 billion square feet, up 9.9% from the previous year, TCNA reported.
U.S. imports of ceramic tile in 2021 reached their highest level in 15 years, according to the TCNA. The 2.23 billion square feet of tile imported last year was a 13.6% increase from 2020. Spain, which in 2020 supplanted China as the largest exporter of ceramic tile to the U.S. by volume, maintained this leading position. Spanish imports held a 22.2% share of total U.S. imports by volume in 2021, up from 20.7% the previous year.
Laminate
The resurgent laminate flooring category continued on its upward trajectory in 2021 as sales reached $1.304 billion last year, FCNews research shows. That represents a 7% increase over 2020, which was revised upward for this year’s report. (Additional data released several months after the publication of last year’s Statistical Issue spurred the revision.)
Volume-wise, the category grew by 3%, a slower rate compared to sales, reflecting higher prices for resins, melamine and fiberboard materials—the primary ingredients in many laminate floors. Suppliers confirmed the discrepancy was due to the rising material costs and the inflationary pressures they faced, which gave them no other option than to raise prices. While this surely impacted the average selling price of laminate, there’s no doubt the category also achieved some measure of true organic growth due to higher consumption of products in the mid-to upper end of the laminate market.
As expected, home centers continued to generate the lion’s share of laminate flooring sales in the U.S. market. FCNews research shows the likes of Home Depot, Lowe’s and Menards increased their respective shares of laminate flooring sales to represent 39%, 23% and 6%, respectively. Combined, they account for more than two-thirds of laminate sales.
Alternatively, specialty retail’s share of laminate sales in 2021 was estimated to have fallen to 13.4%, down from roughly 20% in 2020. But that’s not entirely their fault. In 2020, in the immediate aftermath of the pandemic, most specialty retail stores were ordered to close while home centers remained opened. That was due in large measure to home centers’ classification as “essential businesses.” However, it is estimated that the specialty retail channel recouped some of the share lost as the year progressed, carrying over into 2021.
Hardwood
Hardwood flooring manufacturers incurred significant costs throughout 2021, which resulted in an inordinate amount of price hikes for their distributor and retailer partners down stream. This helps explain why value outpaced volume last year.
FCNews research shows wood flooring sales at the first point of sales in 2021 totaled $2.67 billion, a staggering 21% jump over 2020. Again, much of that—roughly 10% according to some executives’ estimates— can be attributed to sky-high lumber prices, adhesives, etc. Comparatively, hardwood square footage was approximately 1.03 billion square feet last year. More importantly, that was the first time the category surpassed the billion-square-foot mark since 2006.
Some of the growth that the hardwood segment generated was also due to organic growth. Suppliers cited strong demand for wood, which is still considered the aspirational choice among consumers for flooring. With home values increasing to record levels, homeowners are willing to invest more dollars and are upgrading their preferences when completing home remodeling projects. All of which is welcomed news for the hardwood category.
FCNews research shows residential replacement activity—the largest segment in terms of wood flooring consumption—reached nearly 60% in 2021; that’s a 10-year high. By that same token, floor covering retailers grew their share of the pile—ever so slightly—to 32%, up from 30% the year prior.
Meanwhile, home centers accounted for roughly 40% of hardwood flooring consumption in 2021, up from about 38% in 2020. This mirrors the market share shift seen with other categories like laminate. Not to be outdone, professional hardwood flooring contractors built on their share of category sales in 2021, growing from approximately 18% to 20% of sales.
FCNews research shows the residential market made up about 76% of total resilient revenue or $6.407 billion in sales versus 72.1% of total resilient revenue or $4.722 billion in sales in 2020. With respect to volume, residential resilient accounted for about 79% of square footage shipped or 4.648 billion square feet, versus 76.8% of square footage shipped or 4.114 billion square feet in 2020.
The residential segment was supported in large part by the housing market boom. Despite supply chain and labor issues, new home starts rose for the 12th consecutive year and were at their highest point since 2006, according to the U.S. Census Bureau. The 1.6 million units started in 2021 represented a 16% gain over the 1.38 million total from 2020. Single-family starts in 2021 totaled 1.12 million, up 13.4% from the previous year, while multi-family starts in 2021 grew 22.1%.
The bulk of the resilient category’s activity was driven by residential LVT (including glue-down, flexible click, loose lay, SPC, WPC and a relatively new sub-segment called mineral core), which generated an estimated $5.785 billion in 2021, versus $4.177 billion in 2020. That’s a gain of 38.5%. In terms of volume, residential LVT accounted for 3.417 billion square feet, up from 2.835 billion square feet in 2020 for an increase of 20.5%.
(Each flooring category has its own detailed report. Please see the June 20/27 print edition of FCNews or visit FCNews.net to view each report.)