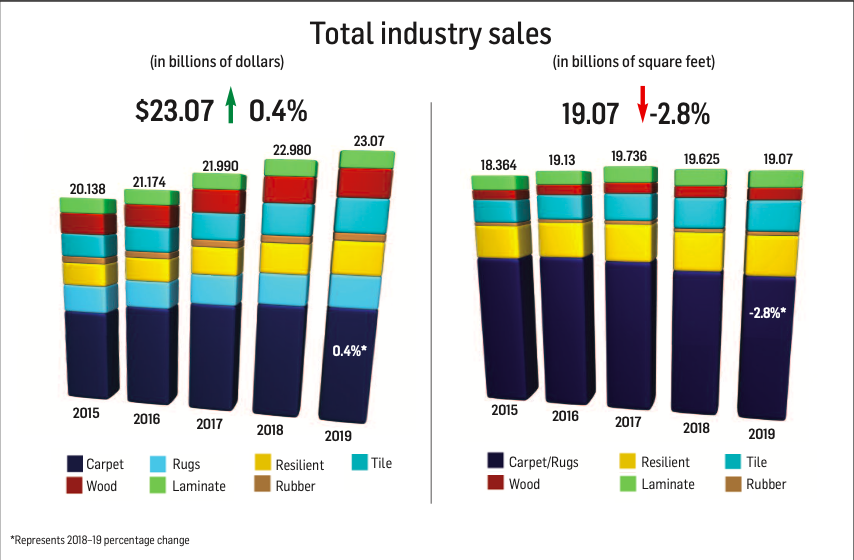
 There are two ways to look at the flooring industry as a whole in 2019, depending on whether ones sees the glass as half full or half empty. On one hand, sales eclipsed the $23 billion mark for the first time since 2006. On the other hand, the 0.4% growth in dollars was the lowest since 2009, when the industry declined significantly due to the Great Recession.
Shifting back to the positive side, the industry continued its growth curve in terms of dollars, albeit ever so slightly, a journey that began in 2010. Truth be told, had it not been for the resilient category in general and the waterproof subsegment in particular—which is basically carrying the floor covering industry on its back—the industry would have posted a decline in dollars for the first time in 10 years.
That’s the good news. The not-so-good news is that it is becoming obvious that resilient is cannibalizing dollars from just about every other flooring category, all of which were either down slightly or significantly in both dollars and volume, with the exception of ceramic, which posted a very modest increase. While dollar growth rates pale in comparison to the mid-2000 heydays, at least it was in the black. However, the same cannot be said of square footage. Total volume was down 2.8%, its second straight year of decline following six consecutive years of increases.
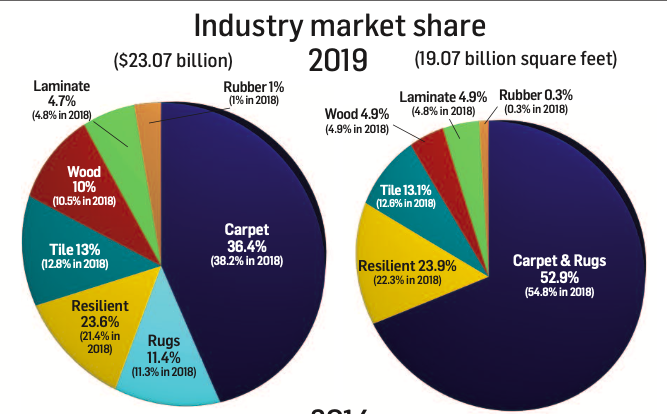
But on a positive note, square footage is still higher than the 2009-15 period and almost on par with 2006. FCNews research reveals that carpet and rugs (which comprises 52.9% of industry volume) dropped roughly 660 million square feet (following a 475 million-square-foot dip in 2018), and not even the high-powered resilient segment can make up for that. For the record, the industry was up about 4.6% in dollars and down 0.6% in volume in 2018. This comes on the heels of 3.85% growth in dollars and 3.2% in volume in 2017; 5.1% growth in dollars and 3.8% in volume in 2016; 4.4% growth in dollars and 3.2% in volume in 2015; and 3.6% and 1.8% growth, respectively, in 2014.
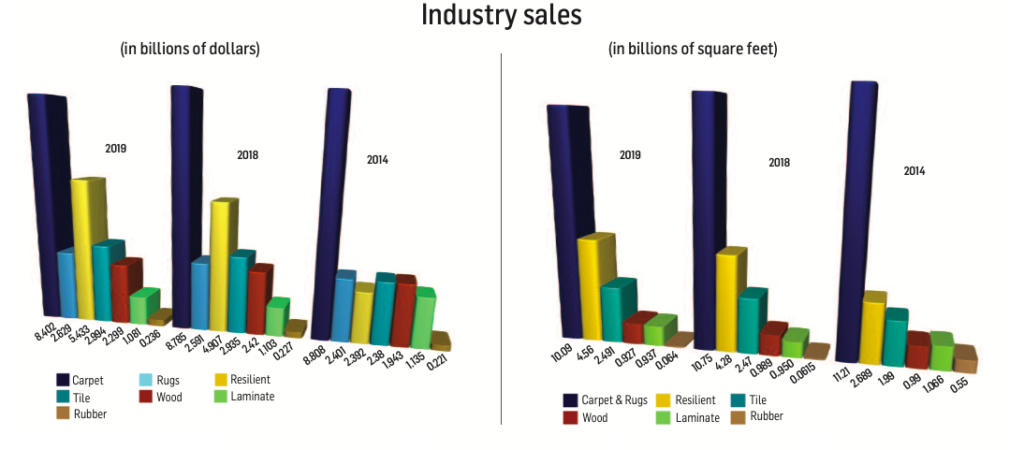
FCNews’ exclusive research reveals total 2019 flooring sales topped out at $23.07 billion and 19.07 billion square feet. It’s the highest dollar count since 2006 and the fourth-highest volume number since 2008. (Note: These numbers are in wholesale dollars reflecting the first point of sale. They also do not include stone flooring, nor do they account for ceramic wall tile, cove base products and rubber accessories.)
Some good news: The industry is beginning to get close to the peak it reached in 2006, when sales of $24.175 billion were posted. Flooring currently sits just 4.6% below 2006’s dollar mark although 28% off in volume. What does that mean? More good news: Back then, the average square foot price of flooring was a shade under $0.92. Today, that figure is $1.21, up from $1.17 in 2018. Attribute that to better goods infiltrating the marketplace, favorable product mixes, more retailers using credit as a tool and, of course, a stronger economy with historically low unemployment rates. Tariffs on Chinese-imported LVT, WPC and rigid core also contributed, going from 10% to 25% at one point and then back down to 10% in some cases and even 0 for SPC/rigid core.
Let’s look at the industry in another way. When we entered this decade back in 2010, we were recovering from the Great Recession and flooring sales were $16.221 billion and 16.625 billion square feet. As we reached the end of the decade, the industry was up 42.2% in dollars and 14.3% in volume. So, the average selling price of one-square-foot of flooring has increased $0.24 in the last 10 years.
Another thing to keep in mind about the numbers: Ten years ago, FCNews included cove base and accessories in its rubber flooring numbers. Three years ago, we made the decision to include only sheet and tile flooring in our rubber numbers and only adjusted back to 2012. In the absence of that change, 2019’s volume could have eclipsed 2007’s volume figures.
As mentioned, the average selling price of all flooring in 2019 was $1.21, up from $1.17 in 2018 and $1.11 in 2017. Two years ago, price increases drove the rise, particularly in carpet and wood, most noticeably on red and white oak species. But in 2019, it had to do with tariffs on Chinese imports, especially in the resilient category, and a shift in hardwood from less expensive Chinese imports to pricier domestic goods.
A closer look at the resilient category over the last 13 years illustrates the rise in ASP. Back in 2006, the average selling price for all resilient flooring was $0.64. In 2017, it was $1.04. It was up a dime in 2018. Add another nickel in 2019. So, now we are at $1.19. A decade ago, sheet vinyl, vinyl composition tile (VCT) and the low-cost, peel-and-stick tile commanded 75% of dollars. Last year, that number plummeted to 19.7%, down from 22.5% in 2018 and 28.8% in 2017. (In terms of volume, that number is a healthier 40%.) The increased usage of the higher-cost LVT, both residentially and commercially, and now WPC/SPC/ rigid, have been industry game changers.
But it’s not just resilient. The average ceramic tile price has increased from $0.95 to $1.20 per square foot over the last 10 years, and hardwood has seen an average-square-price jump from $2.36 to $2.48 per square foot. Even the maligned soft surface segment—which has seen its share of the market dip from 61.2% in 2010 to 47.8% in 2019 (down from 49.5% in 2018)—has seen an increase in average pricing from $0.90 to $1.09.
Why has the growth not been more robust? For one, housing has not led the recovery from the recession and is actually lagging the overall economy. While it continues to grow each year, housing starts are still below the 1.4 million threshold that is considered normal. Also, in past recoveries there has always been a period of strong economic growth before it settles into normal growth mode. That has not happened with this strong economy.
But there have been many positives. The U.S. economy continues to grow as consumer spending (due to rising employment) and household income (and with it, disposable personal income) are on the rise. Commercial construction continues to rebound, and corporate pre-tax profits grew again in 2019.
Also, not to be underestimated as a flooring market driver is an aging baby boomer population, a key demographic. Boomers control the lion’s share of this country’s disposable income and are in their prime spending years. Furthermore, many are buying second homes—or at the very least transitioning into different places of residence.
 Resilient flooring by the numbers
Much like the past few years, the resilient category continues to be the locomotive powering the industry, with rigid core serving as the catalyst for this explosive growth in 2019. Last year, resilient (not including rubber flooring, which checked in at $236.5 million) carried the industry on its shoulders, posting its only appreciable gains, rising 10.5% to $5.433 billion from $4.916 billion in 2018. Since 2010, the category has increased a stunning 215% and is now is at its highest point in history in terms of dollars. Interestingly, it has “only” increased 92.6% in volume, again accentuating the migration from residential/commercial sheet and VCT to WPC/rigid core and the transition from felt- backed products to fiberglass sheet.
In the grand scheme of things, resilient now accounts for 23.6% of the total flooring market in dollars and 23.9% in volume (up from 22.3% in 2018) after a 6.5% rise in units to 4.564 billion square feet. In 2018, resilient held a 21.4% market share in terms of dollars, which was up from 18.2% in 2017, 16.5% in 2016; 13.3% in 2015; and 12.2% in 2014. Interestingly, its market share in volume had stayed around 15% for eight consecutive years until leaping to 17% in 2015; 18.8% in 2016; 20% in 2017; 22.3% in 2018 and now 24%.
FCNews research reveals just how much rigid core is driving growth of the segment. Last year, rigid core checked in at $1.242 billion and 738 million square feet. That translates into 22.8% of resilient’s dollars and 16.2% of its volume. To put this in perspective, total LVT sales just five years ago were $1.14 billion. So, rigid core alone is greater than the entire LVT market in 2014.
The category that is losing significant share within the LVT segment is flexible click. Case in point: In 2018, flexible click checked in at $497 million and 384 million square feet. Those numbers dropped to $384 million and 292 million square feet in 2019. That’s a dip of 22.7% and 24%, respectively. And volume is off 31.4% from 2017.
Yes, rigid core and WPC have taken on a life of its own over these last few years, although rigid core has become the star of the show. Even WPC, which had spread like wildfire for a number of years, finally met its match. While WPC grew from $902 million and 458 million square feet in 2017 to $1.18 billion and 563 million square feet in 2018, those numbers dipped in 2019 to $974 million and 461 million square feet. About 95% of WPC applications are on the residential side.
But no matter how you slice it, WPC and rigid core dominated the residential resilient market. These categories account for two-thirds of all residential LVT sales (up from 61.9%) and 56.2% of all residential resilient sales. They also account for 44% of total LVT sales.
WPC and rigid core are not major players on the commercial LVT side, which remains a glue-down market. Commercial LVT in 2019 was up about 12% in dollars and 15% in volume. Glue down represents 71% of the $1.22 billion in sales and 74.4% of the 700 million square feet. Loose lay also has a nice presence here, representing 13% of commercial LVT sales and 9.2% of volume.
As LVT grows, it is taking share from other resilient categories, especially VCT, which today is only 4.4% of resilient dollars and 7.7% of volume. Seven years ago, those numbers were 19.7% and 26.8%, respectively. FCNews estimates the VCT market to be about $239 million and 351 million square feet.
But it is also nipping share from sheet vinyl as well. Sheet vinyl—residential and commercial combined—has declined 4.5% in the last five years, going from $756 million in 2014 to $722 million in 2019. The residential sheet market dropped a little less than 2% in 2019 from $508 million to $500 million. We do show a slight volume increase, which signified price pressures.
The commercial sheet market declined 4.3% in 2019 with estimated sales of $222.5 million vs. $232.5 million in 2018. Volume dropped from 109.5 million square feet to 106.5 million square feet. It remains a mainstay in health care, where a more seamless floor covering is demanded. The category has been a challenge for just about everyone, with heterogeneous continuing to take share from homogeneous—a segment that really has only three players remaining: Armstrong Flooring, Mannington and Tarkett.
Carpet by the numbers
Much to the detriment of carpet, hard surface is the preferred choice for flooring throughout the home. What’s more, homeowners on average are staying in their homes five years longer than they did a decade earlier, cutting into the replacement cycle of carpet.
These factors played a part in carpet’s 2019 results, which showed the category falling 4.36% in sales to $8.402 billion while volume (including rugs) declined 6.14% to 10.09 billion square feet, marking the second year in a row the segment finished in negative territory. Residential sales were down 6.5% while volume fell 6.8%— the largest percentage drop in 10 years for residential.
While carpet remains the largest flooring segment, accounting for 52.9% of the 19.07 billion square foot flooring market, its share has steadily eroded. A decade ago, for example, carpet/rugs made up 66.6% of the flooring industry, a change of nearly 13 points.
Where carpet is struggling the most is in the middle—$8 to $13 sq. yd. (wholesale), which represents 45% of the market. Where there has been strength is in the upper end at $14-$15 per sq. yd. and higher as consumers opt for better end goods in the few areas of the home where carpet remains, i.e., the bedroom.
The commodity market (under $8 per sq. yd.) has also performed on the strength of solution-dyed polyester, which has become the most sought-after fiber in carpet.
Commercial carpet, which makes up an estimated 44.2% of the total carpet market, was down 1.5% in sales and 5.2% in volume in 2019, the fourth consecutive year in which both sales and volume fell. Rugs, which has benefited by the growth of hard surfaces as a complementary add-on product, saw a 1.5% sales increase in 2019.
 Ceramic tile flooring by the numbers
The healthy economy in 2019 helped tile inch forward, although not at the same rate of growth as the economic rebound. Last year saw low, single-digit growth in terms of overall dollar sales while volume remained mostly flat.
While industry insiders said the reasons behind the disparity between tile consumption (down in 2019) and the overall strength of the U.S. economy are unknown, significant factors were at play.
Those factors included preliminary countervailing duty and antidumping determinations that were announced in September 2019 and November 2019, respectively. The trade remedy case was filed by a coalition of several U.S. manufacturers, which petitioned the federal government to remedy unfairly dumped and subsidized ceramic tile imports from China.
The impact of the decrease in Chinese imports due to the rulings were especially felt in the fourth quarter, and insiders agree overall consumption would have been up otherwise.
Although China remained the largest exporter of ceramic tile to the U.S. by volume, imports made up 21.2% of the total vs. 31.5% in 2018, which represented China’s lowest share of U.S. imports since 2008.
Another shakeup in imports was Spain surpassing Italy as the third-largest exporter of tile to the U.S., making up 16.9% of U.S. imports by volume, up from 14.1% in 2018. Imports from Mexico comprised 17.3% of total U.S. imports in 2019, unchanged from 2018. The next largest exporters were Italy and Brazil.
The commercial tile market saw slight gains in 2019, driven largely by strong growth in health care, hospitality and education. Residential remains about 60% share of the ceramic tile market, however, which saw positive indicators around housing in 2019.
Several challenges continue to impact the category, and perhaps none more so than the shortage of qualified labor and the continued growth of the resilient category. In fact, for some tile suppliers, the labor shortage and competition from resilient created a perfect storm. “Labor for tile installation had not paced with demand, resulting in longer project lead times and higher installation costs,” said Mark Shannon, executive vice president of sales, Crossville. “With lower labor costs and quicker installation times, LVT has gained traction as a flooring alternative.”
However, tile suppliers say that while LVT and other resilient products are hammering other hard surface categories, it has more to contend with when it comes to ceramics. That’s due to the category’s performance and design attributes.
Tile suppliers agree, continued growth will be incumbent upon touting tile’s benefits, signature design aesthetics and application opportunities.
 Hardwood and laminates by the numbers
A significant decline in hardwood and laminate flooring from China—historically the largest exporter of flooring products to the U.S. for decades— coupled with the continual onslaught from competing hard surface categories such as LVT, WPC and rigid hardwood floor alternatives, resulted in sizeable declines in the volume of both flooring segments in 2019.
FCNews research shows the hardwood category generated $2.299 billion in sales in 2019, a 5% decrease from 2018. That’s a significant turnaround from the 2017-18 period in which hardwood sales grew by 4.4%—not stellar growth by any means, but movement in a positive direction nonetheless. It also marks the lowest hardwood sales since 2016, which the category generated just over $2.23 billion in revenues at the first point of sale. In terms of volume, hardwood reached 926.7 million square feet—a 6.3% decline from 2018’s revised volume of 989 million square feet. Although that’s not as lofty as wood’s high-water mark in 2006, when it eclipsed 1.2 billion square feet, it’s still respectable.
The downturn in hardwood sales placed the category at just under 10% of total flooring sales and 4.9% of total volume for 2019. Compared to five years ago, hardwood represented roughly the same percentage of total flooring sales but only 4.3% of volume. Looking back 10 years, wood was roughly the same percentage of sales as 2019 and 2014—but only 4% of square footage sold.
“2018 saw a significant increase in hardwood imports out of China as people were buying ahead of the tariffs and duties, and in 2019 hardwood imports out of China generally declined as that pre-purchased volume was consumed,” said Brian Carson CEO of AHF Products, which sources products from the U.S. and Asia. The company recently announced plans to shut its Shanghai manufacturing facility and shift production to its plant in Cambodia. “In 2020 pre-COVID-19, we saw an increase in Asian imports but a significant increase away from China to other countries.”
That was pretty much the same case with laminate flooring, where imports from China fell from more than 65% to less than 48% in a year and half’s time. Laminate volume was also negatively impacted by diminished supply from several key producers in Canada and fewer laminate brands represented at the specialty retail level.
“The category was definitely down for the year,” said Dan Natkin, president of the North American Laminate Flooring Association (NALFA) and vice president of hardwood and laminate at Mannington.
FCNews research corroborates estimates from industry observers. Our calculations show laminate flooring sales at the first point of distribution totaled $1.081 billion last year— that’s a decrease of 2% over 2018. More significantly, it marks the third consecutive year of sales declines in the category, arguably a direct result of aggressive competition from the likes of WPC and rigid. The volume of laminate flooring solid in 2019 also took a hit, albeit at a lower rate compared to dollars. FCNews research placed volume shipped in 2019 at roughly 937 million square feet, a 1.4% downturn from 2018.
Despite the dropoff, laminate flooring’s share of the overall U.S. market came in at roughly 4.7%, not far off from 4.8% in 2018. However, that’s off tangibly from 5.8% of total flooring sales in 2014. Likewise, the category’s portion of overall volume dipped year over year as its share of square footage shipped was approximately 4.9% last year—down from a 5.1% share of the total flooring market volume in 2018 and off from roughly 8% just five years ago. Compared to 10 years ago, laminate represented 6.6% of total flooring industry dollars and 5.5% of volume.
Laminate’s decline in 2019 is particularly evident when compared to its standing relative to other hard surface categories. Last year, laminate accounted for 8.9% of total hard surface sales and 10.4% of volume sold. While that’s down slightly from 9.5% and 11.5% in 2018, respectively, laminate’s share of total hard surfaces was 13.8% in dollars and 15.2% of hard surface volume in 2014. Going back 10 years, laminate flooring accounted for just over 17% of hard surface sales.